With 2015 coming to a stormy end, Lymington Triathlon Club held its last inter-club time trial training day on a cold and windy Saturday morning in December.
Storm Desmond was in full swing on the day and kindly brought along a strong southwesterly wind – a direct headwind on the final stretch of the course. Eight brave club members made it out for the session with times slightly higher than expected due to the challenging conditions on the day. Only one personal best was achieved and that was due to it being a first attempt at a time trial, but a PB all the same!
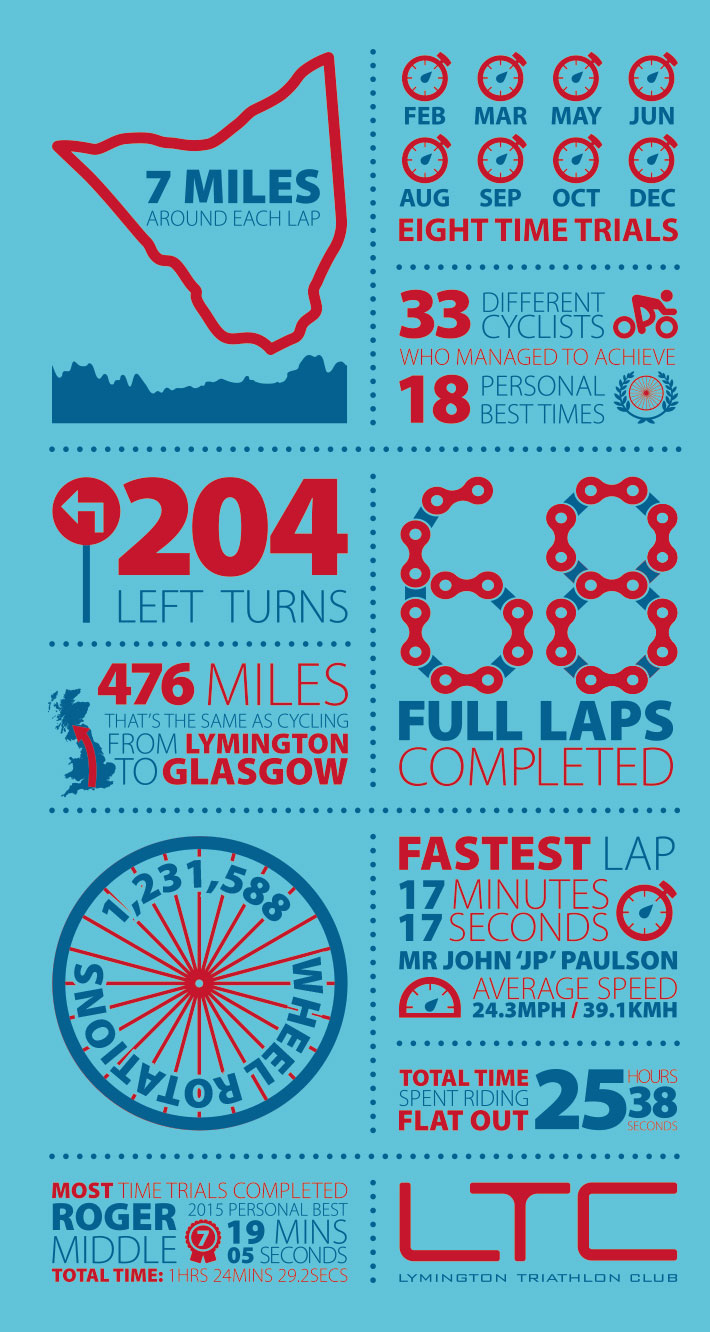
To round up the season, Tinstar Design dusted off the abacus from under Nick’s desk and used it to calculate a few numbers from the available timings and data on the Club website. The result was the below infographic summarising all of the key figures and achievements from across the training sessions held throughout the year.
Infographics
According to a rather popular search engine, an infographic is a visual representation of information or data and sums the concept up perfectly: “a good infographic is worth a thousand words.”
Using an infographic to visualise data is becoming an ever more popular way of displaying facts and figures in a way that is easy to understand. A good infographic will capture interest from a wider audience than those who are happy to look through a spreadsheet. It is important that an infographic is easy on the eye, attracting different people to specific snippets of your data which they would normally read over, all because they are presented in a catchy way.
To see your facts and figures visualised into an attractive infographic which is sure to impress your customers, contact Tinstar Design today.

